Consultancy and Programming
Technical Pages
About Us
Advice, tips, techniques and downloads for Visual Foxpro developers.
Versión en español de este artículo
If you want an easy way of creating charts and graphs for your Visual FoxPro application, take a look at our SimpleChart control. Download the control from our web site, add it to your forms, adjust a few properties, and before you know it you will be producing good-looking line graphs, histograms, pie charts and a dozen other two- and three-dimensional charts.
SimpleChart is essentially a wrapper for Microsoft's MSChart ActiveX control, which comes free with Visual FoxPro (versions 6.0 and above). If you've ever used MSChart, you'll know that it can produce a wide range of useful charts, but it can hardly be described as programmer-friendly. Getting the data into the chart is hard enough. You also have to get to grips with a confusing array of properties and methods in order to customise the appearance of the chart.
The SimpleChart control aims to take the hard work out of using MSChart. As a minimum, you only have to provide a table or cursor for the data, set two properties of the control and call a single method.
SimpleChart is free. To download it, see the instructions at end of this article.
The first step in using SimpleChart is to get the data into a table or cursor. Essentially, this should contain one field for each of the series to be plotted, plus, optionally, a further field to hold the row labels. Each record in the cursor should correspond to one data point. (Although we will use the term cursor from now, you could just as well use a physical table.)
For example, let's suppose you want to plot monthly sales values and monthly sales quantities for a given year. Your cursor might look something like this:
| MONTH_NAME | SALES_VAL | SALES_QTY |
| JAN | 2400 | 3200 |
| FEB | 2412 | 3300 |
| MAR | 2999 | 3800 |
| APR | 3042 | 4000 |
| MAY | 3300 | 4200 |
| JUN | 3699 | 6000 |
| JUL | 3717 | 6300 |
| AUG | 3762 | 6900 |
| SEP | 3753 | 6750 |
| OCT | 3300 | 5000 |
| NOV | 2520 | 4500 |
| DEC | 2550 | 4400 |
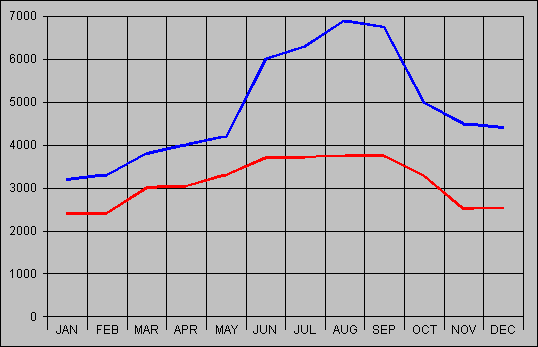
This will produce a chart with two lines and twelve data points, with the horizontal axis showing the twelve month names (Figure 1). If you want to plot additional series along the same axes, just add further fields to the cursor.

Figure 1: A simple chart showing two time series
The next step is to drop the SimpleChart control onto a form, and to adjust two of its properties. You can do this either in the Form Designer or at a suitable point in your code. A good place to write the code would be in the control's Init event.
The properties in question are:
So to continue with the above example, if the alias of the cursor is csrSales, you might write the following code in the control's Init event:
THIS.cAlias = "csrSales"
THIS.cData = "SALES_VAL,SALES_QTY"
Finally, call the control's CreateChart method to create the chart and make it visible on the form, like so:
THIS.CreateChart
You don't need to pass any parameters to the CreateChart method. The only constraint is that the cursor or table must be open before you call it.
The chart thus produced will be a simple two-dimensional line series, similar to the one shown in Figure 1. By default, there will be no legend or titles, and the x-axis will show default labels. Fortunately, it is easy to display other chart types and to customise their appearance in various ways.
To achieve this, adjust any or all of the properties listed below. You would normally do this before you call the CreateChart method for the first time. If you want to change any of these properties after you have displayed the chart, just call CreateChart again to make the changes visible.
THIS.cColours = "BLUE,WHITE,YELLOW"(These are not case-sensitive.)
All of the above properties take sensible defaults, so you can ignore any that you are not interested in.
SimpleChart performs a minimum of error checking. The CreateChart method performs the following checks:
If any of these checks fails, CreateChart will return .F. and the chart will not be created. If all is well, the method will return .T.
In July 1999, Microsoft announced that it would no longer support the MSChart ActiveX control within Internet Explorer. This is because the control is single-threaded and is therefore incompatible with Internet Explorer 4.0 and above.
Don't worry. This does not affect the use of MSChart within VFP. The control works happily in desktop applications.
Click the link below to download SIMPLECHART.ZIP. This zip file contains a class library, which in turn contains the control. The control includes a Documentation method which gives brief instructions for using the control. The total download size is a mere 9 KB.
We hope you find the control useful. Please let us have your feedback (see our Contacts page).
Note added July 2002: More information about SimpleChart is available in a new Foxstuff article, SimpleChart revisited.
Mike Lewis Consultants Ltd. March 2002. Revised November 2003 and January 2006.
FoxStuff is maintained by Mike Lewis Consultants Ltd. as a service to the VFP community. Feel free to download and use any code or components, and to pass around copies of the articles (but please do not remove our copyright notices or disclaimers).
The information given on this site has been carefully checked and is believed to be correct, but no legal liability can be accepted for its use. Do not use code, components or techniques unless you are satisfied that they will work correctly in your applications.
© Copyright Mike Lewis Consultants Ltd.